
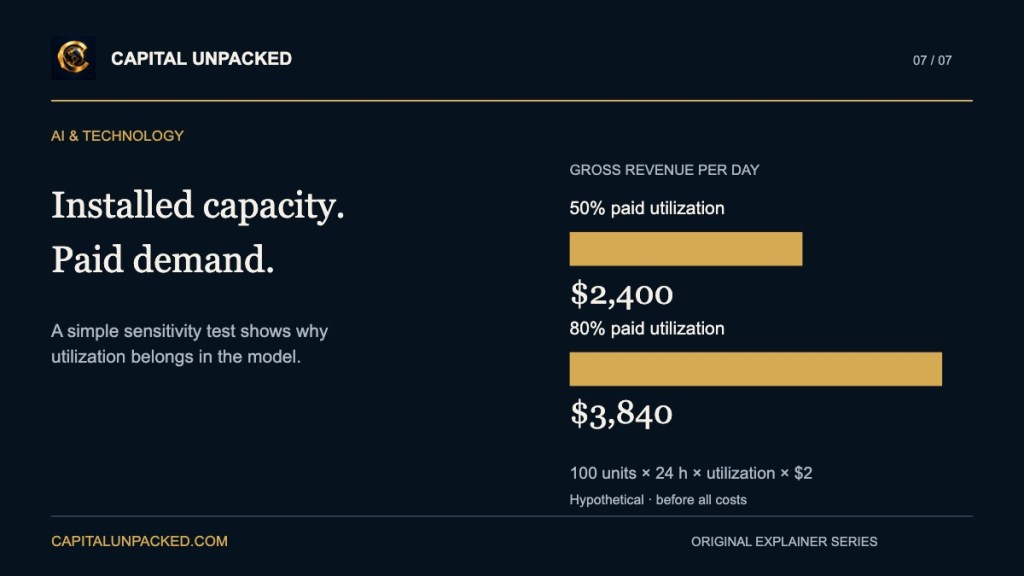
Imagine an operator with 100 identical units of billable compute capacity. The equipment is installed, powered and ready. That establishes potential supply. It does not establish how many hours customers will buy.
Our hypothetical model assumes a realized price of $2 per billable unit-hour and a 24-hour day. At 50 percent paid utilization, gross daily revenue is 100 × 24 × 0.50 × $2, or $2,400. At 80 percent, it is $3,840. The $1,440 difference comes entirely from selling more hours, with installed capacity unchanged.
Every number is invented for explanation. The units are generic, not an advertised GPU product, and the calculation assumes all sold hours are paid at the stated price. It excludes electricity, staffing, networking, financing, depreciation, taxes and other costs. The results are revenue, not profit or cash collected.
The definition of utilization matters as much as its percentage. A technically busy processor is not automatically generating a paid customer hour. An equipment availability measure is different again. Before comparing operators, ask what is counted in the numerator and which capacity and time are included in the denominator.
A useful model then changes one assumption at a time. What if paid demand falls? What if price falls while utilization rises? What if the equipment is ready before customer contracts start? This is a sensitivity exercise, not a market forecast. Installed equipment tells you what a business may be able to supply. Paid utilization and realized pricing help explain what that supply might earn.
Capital Unpacked: original hypothetical sensitivity model. All inputs are invented for explanation. Calculations and illustrations by Capital Unpacked.

